Plotting Only a Colorbar with matplotlib and Determining the Color for a Given Value
TL;DR
When using matplotlib, sometimes you want to create just a colorbar and find out what color a particular value corresponds to on that colorbar.
Example use case: You have some SVG and want to color it based on values, and you also want a colorbar.
Python 3.7.4
How to Do It
Use matplotlib.colorbar.Colorbar. Also, use matplotlib.colors.Normalize to define the value range of the colorbar and to determine what color a given value corresponds to.
First, define the range.
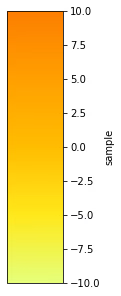
Draw the colorbar. Use matplotlib.pyplot.get_cmap to retrieve the colormap information. The norm we prepared earlier is used to define the range.
When saving, note that you need to specify bbox_inches="tight" as an option, otherwise ticks and label information will be cut off.
Retrieve the corresponding RGBA color.